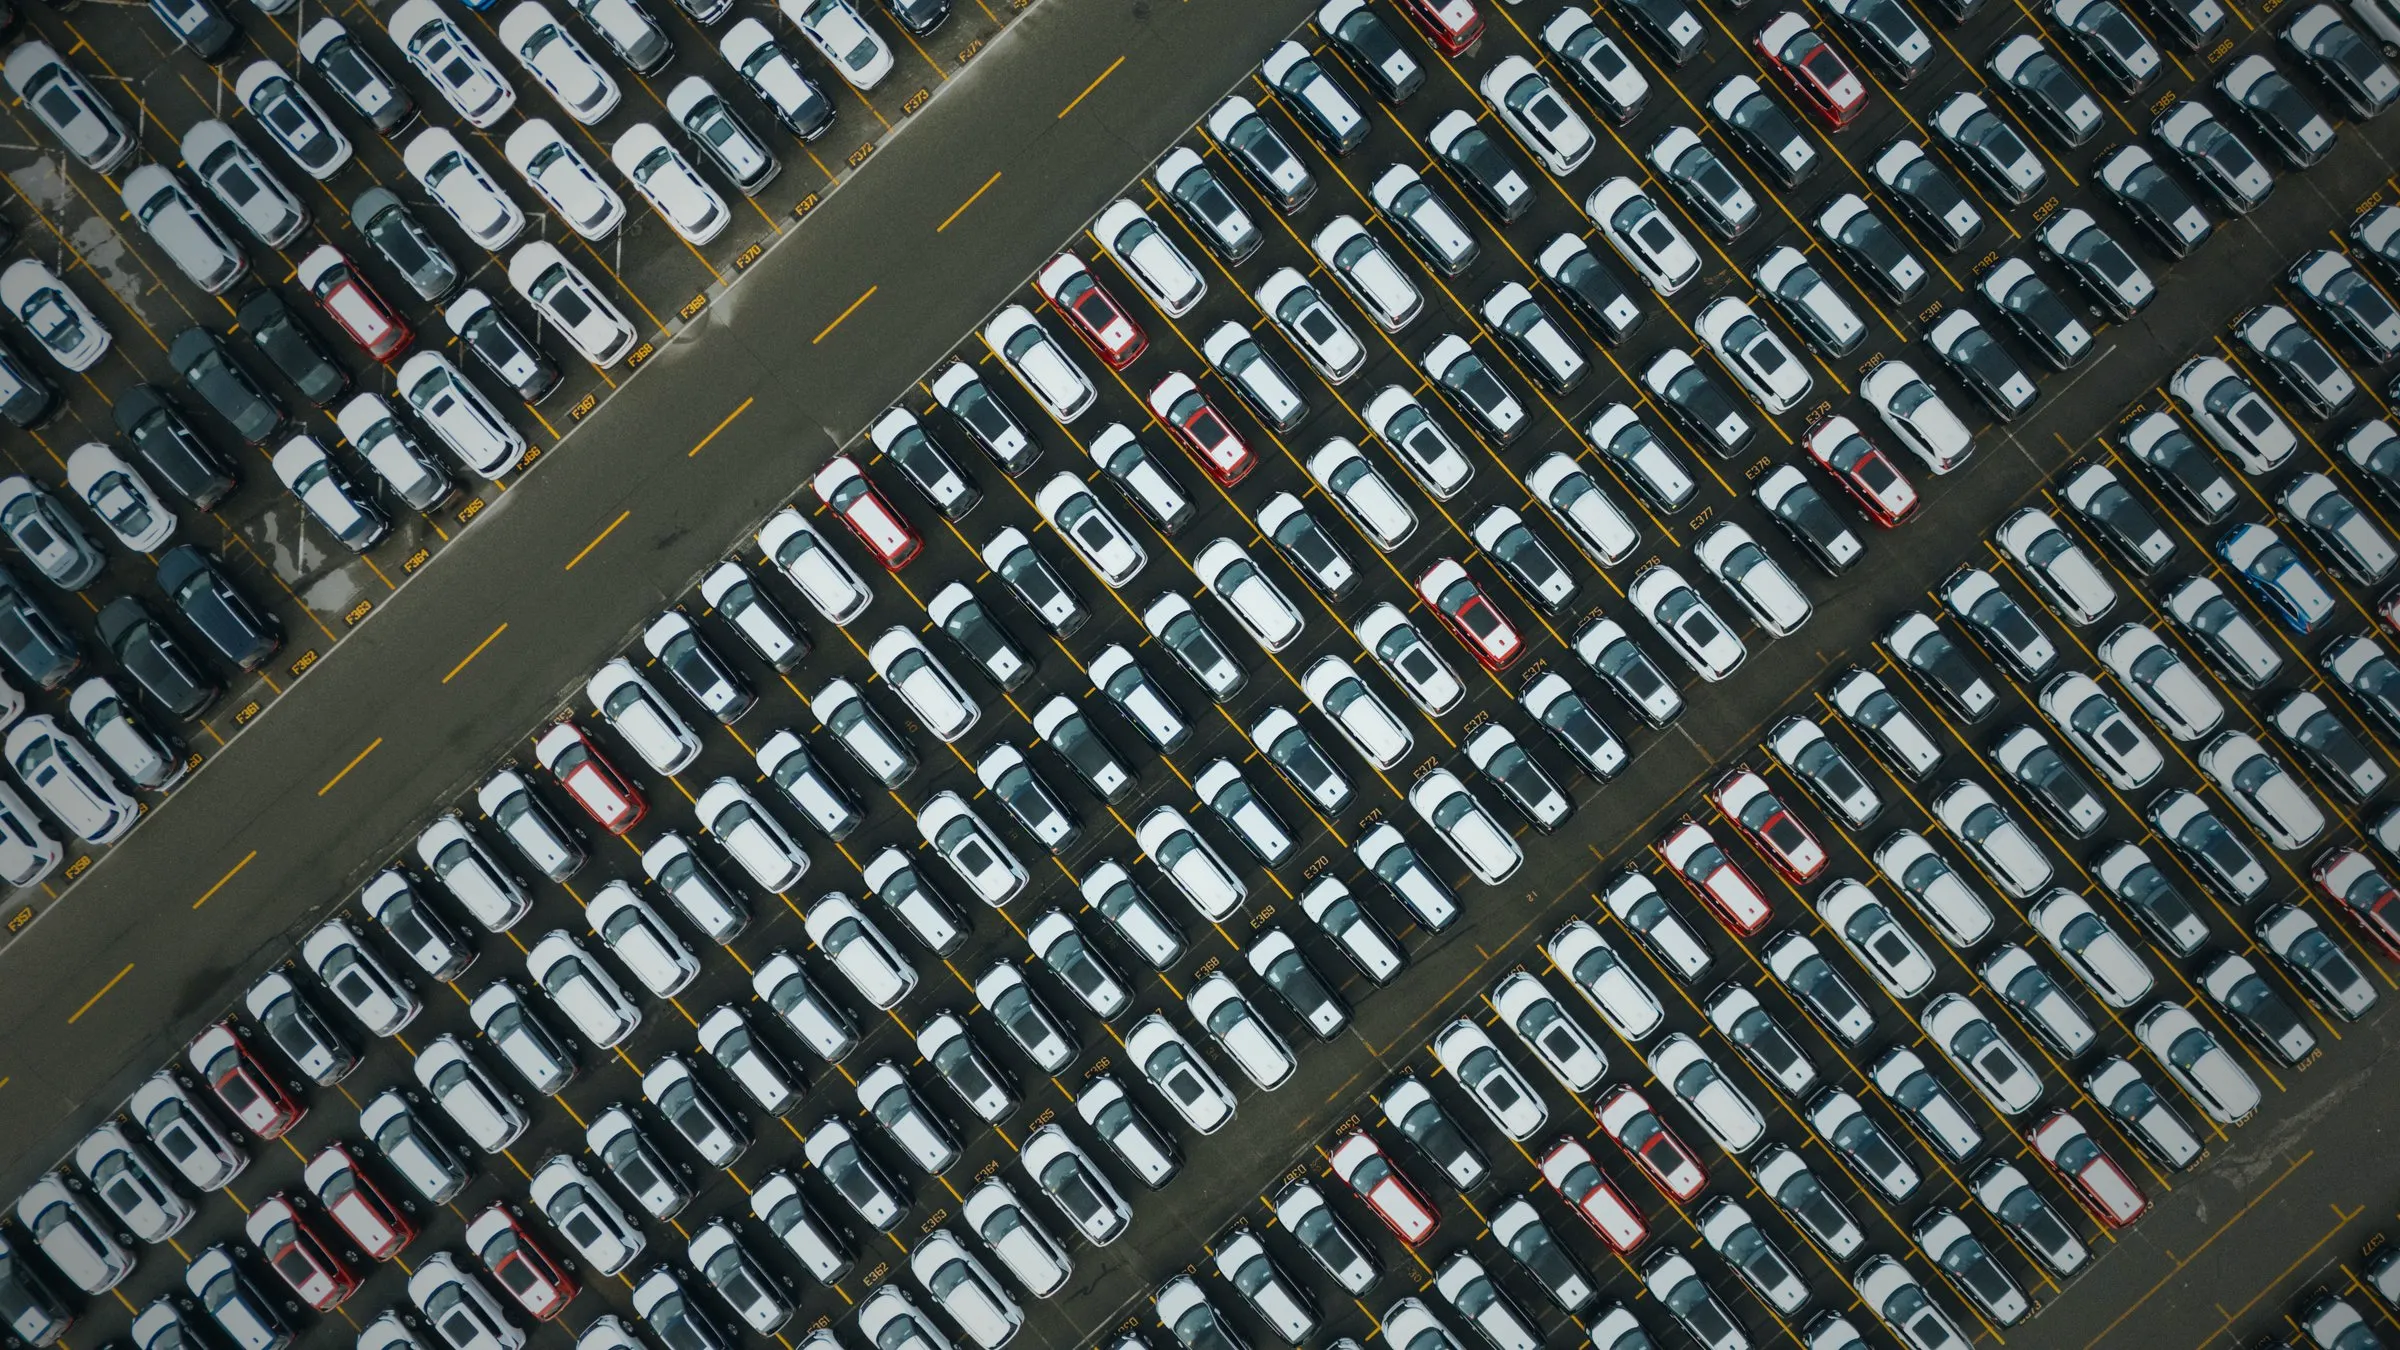
When a car is recalled, the same letter goes to every owner in the affected build range. Many of those cars were never going to fail. The defect often lives in a slice of the production run, but the recall has to cover the whole range, and it lands after the failures have already started.
Recalls work this way because a manufacturer can identify what it built, not what is actually breaking. So they are late, oversized, and physical. Since the start of 2022, 4,030 campaigns have put 147 million vehicles into recall action. We rebuilt the entire public NHTSA record and checked each recall against the signals a connected vehicle already produces. The failure was often there first.
A recall runs on the build sheet, not the failure.
A campaign pulls in the whole production run, then waits for the failures to show. Only a fraction of those cars ever fail, and a quarter of the recalled population is never brought in at all. The failure signature, meanwhile, often sat on the car's own bus for years. Run the recall on the signal instead: catch the signature early, call in the cars already showing it, confirm the remedy took, and close software campaigns over the air where the car allows it. This paper measures how far that reaches.
One thing to be clear about up front. These signals exist on the vehicle today, thrown off every time the car runs. But almost none are captured, transmitted, or analyzed: they are dumped at key-off, stranded inside a supplier's module, or never logged. When this paper calls a recall reachable today, it means a fleet could start collecting that signal with no new hardware, not that anyone collects it now. Reading and processing it is the product.
A1 The blunt instrument
A2 The landscape
| Manufacturer | Campaigns | Vehicles | L1 | L2 | L3 | L1+L2 reach |
|---|---|---|---|---|---|---|
| Ford | 376 | 43.6M | 70 | 70 | 236 | 20.0M |
| Stellantis | 182 | 15.6M | 37 | 38 | 107 | 7.6M |
| Honda | 77 | 14.1M | 7 | 13 | 57 | 3.8M |
| Toyota | 80 | 10.8M | 8 | 18 | 54 | 4.8M |
| Hyundai | 103 | 8.0M | 16 | 13 | 74 | 3.6M |
| VW Group | 164 | 4.6M | 12 | 54 | 98 | 2.8M |
| GM | 130 | 8.7M | 23 | 21 | 86 | 4.0M |
| Tesla | 63 | 12.5M | 31 | 1 | 31 | 12.3M |
A3 Software, the cleanest case
We do not build the over-the-air pipe. From signals already on the bus, we catch the signature, flag the cars already showing it, and confirm the fix took. And we measure the dealer-path gap: where the remedy is code, but the car has no remote route to receive it. Tesla is the counter-proof. 30 software recalls, every one shipped over the air.
A4 Stakes and timing
| Domain | Complaints | Crashes | Deaths |
|---|---|---|---|
| Powertrain / stall | 65,389 | 2,290 | 231 |
| ADAS (FCW/AEB/lane) | 30,403 | 2,806 | 151 |
| Braking / stability | 31,365 | 2,571 | 37 |
| Rear camera (backover) | 6,762 | 423 | 31 |
We classify every recall by where its failure signature lives as a signal, then read the worth in two layers and never blend them. The first is measured today: what the record proves is already being lost while the signal goes uncaptured, the dealer-path gap, the 2.89-year build-to-recall window, the repeat-remedy pool. The second is estimated recovery: what capturing and acting on the signal is worth, every assumption stated. The headline is always the measured layer; the estimates stack on top, in their own color, never hidden inside it.
B1 Three levels of access, one platform
No new hardware
Signals the car already produces but almost no one collects: powertrain, fuel, emissions, stability, ABS, and any fault it already flags. Two paths, no rewiring: read the OBD port, or emit signals the TCU already sees.
- Detect the failure signature earlier
- Prioritize the vehicles already showing it
- Verify the remedy took
- Close software campaigns remotely where the car supports it
One standard API
The ADAS, camera, airbag and BMS signals already exist inside Tier-1 modules; they are just not on a collectible bus. A standard API to emit them is a real integration, not full SDV architecture, and no new sensor or harness.
- Brings the accelerating camera and ADAS wave within reach
- Feature-state and module faults become fleet-visible
- The largest single jump in reachable exposure
Software-defined vehicle
The mechanical and structural residual that carries no signal today. Full SDV architecture plus predictive models is where the system moves from remediation toward prevention. The long build, and the real technical ceiling.
- New sensing on the failure modes that are blind today
- Prediction ahead of the defect
- Requires Tier-1 and OEM standardization
| Access tier | Vehicles | Reach | Exposed burden |
|---|---|---|---|
| L1 today, no new hardware | 44.3M | 30% | $2.0 to 8.1B |
| L2 + standard Tier-1 API | 27.8M | +19% | $3.8 to 17.0B |
| L1 + L2 reachable | 72.0M | 49% | $5.8 to 25.1B |
| L3 full SDV, new sensing | 74.8M | 51% | $14.6 to 68.3B |
| All recalls | 146.8M | 100% | $20.5 to 93.4B |
B2 What turns reach into dollars
Of 612 software recalls, about 329 were pure code that still forced a dealer trip, at roughly $40 to $120 a vehicle in reflash labor and logistics. Over-the-air would collapse most of that wherever the architecture allows a remote route.
The median software recall arrives 2.89 years after the vehicle was built, among campaigns with a usable build date. That is time on the road before the fix. It does not show when the defect became detectable.
26 software recalls (4.68M vehicles) cite a prior failed fix. Per-vehicle verification keeps the same owners from being called back twice.
Dealer-path software recalls carry roughly $0.7 to 2.2B in reflash-and-service cost (this paper's own cost band). The pure-code share could ship over the air, recovering much of it wherever the architecture allows a remote route.
A quarter of recalled vehicles never return, leaving the hazard on the road. Aiming outreach and service capacity at the cars that actually show the signature lifts completion: a 5-point gain on the 72M reachable vehicles is about 3.6M more cars fixed.
The median software recall arrives 2.89 years after build. A fault caught earlier in that window means fewer vehicles built with the defect, and a smaller eventual recall.
This is a worked illustration, not a deployment. The recall is real: Ford fuel-injector fire, 694K vehicles, July 2025, and its public signal really did lead the recall by nearly two years. Here is how the loop would have run it:
Built from the full NHTSA ODI corpus compiled into a 977,000-row database, all vehicle recalls 2022-01 to 2026-06. Vehicle counts are campaign-exposure (potentially-affected units, overlap-inclusive), not unique VINs. Cost is an illustrative band from per-remedy assumptions, cross-checked against the AlixPartners ~$500 per vehicle industry blend (~$73B).
Access tiers are a keyword-and-component classification over NHTSA's own text, built to be conservative. L1+L2 at 49% of vehicle exposure is a modeled estimate; access and detection still have to be confirmed vehicle by vehicle. The complaint-based failure proxy and the targeting lever are directional, labeled modeled, never folded into the headline. A safety recall's legal population is the regulator's to set; available signal makes that population smaller when caught early, the remedy faster and verifiable, and for software remote. Each recall's tier follows from NHTSA's own published text, so every assignment is reproducible.